During an IBM Quantum Hackathon at Parson The Newschool, we developed a novel approach
to visualize the performance of quantum computers. We ended up being runner-ups in the
overall competition and revised our piece for a exhibition at the famous Microscope Gallery in NYC
One measurement on a quantum computer can either match the simulation or be a miss.
By visualizing how many consecutive correct measurements, a quantum computer achieves,
we show its performance. Using a real quantum computer, we measured the same quantum
circuit 1024 times, creating our first dataset for visualization.
With said dataset, we created a grasshopper cluster that analyses the data and outputs
several values to manipulate geometric with. Using this cluster, we could play around with
several different geometries in Grasshopper.
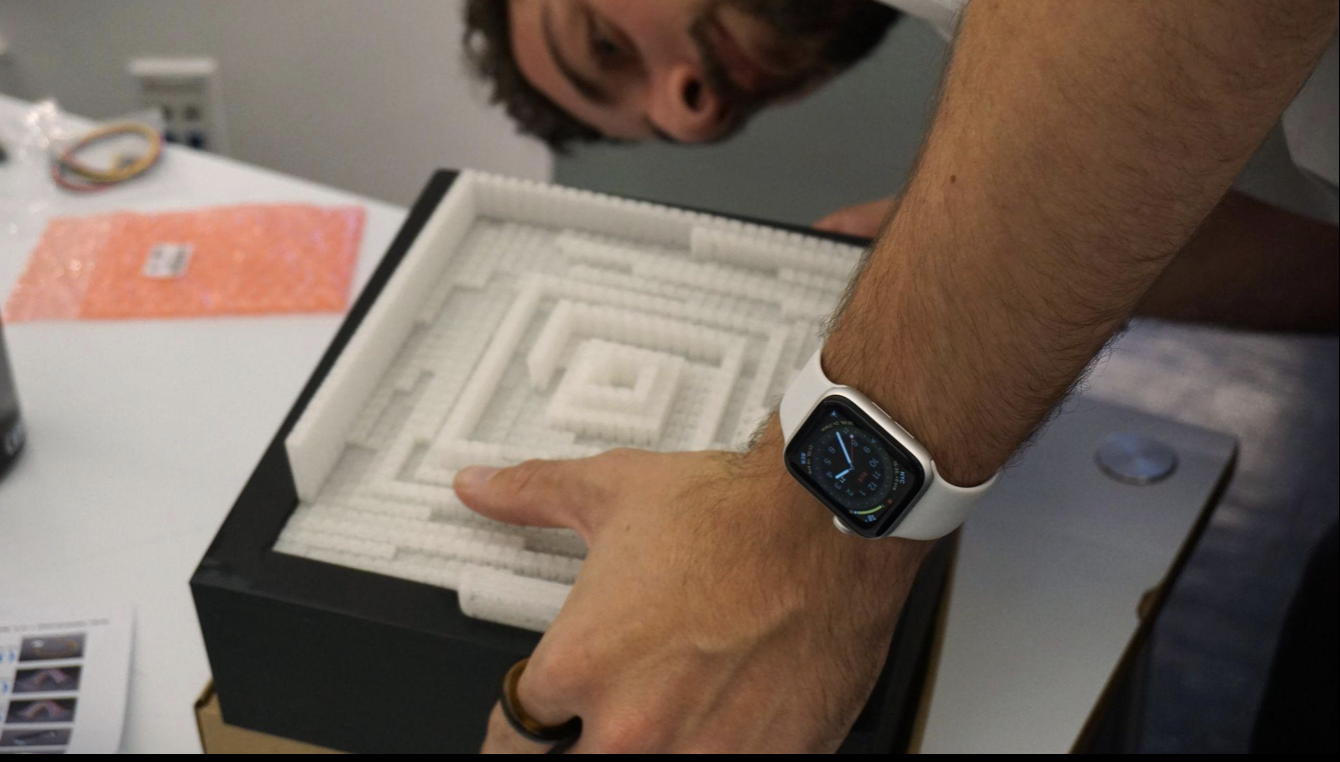
Our overall goal in this project was to turn the theoretical and impalpable concept of
quantum computing into something tangible. Using our Grasshopper cluster, we can automatically
create a corresponding 3D model for printing. This model can be placed on a light table that
uses light to show which quantum state has been measured at each point. All required code and
files also get created automatically.
After creating the physical prototype, we got to be part of an exhibition at the microscope gallery
as part of a collaboration between IBM and Parsons. To create a less physically limited, more interactive
version, we decided to go digital.
Without any interaction, the visitor only sees the flat spiral of columns. As soon as they press
one of the three buttons the visualization of one of the three quantum runs appears.
To follow up on the exhibition, I turned the project into a website that receives new quantum data every 20
minutes.
With limited coding experience from Arduino and building this website, I leveraged Chatgpt to fully develop
and deploy the final page on »
ibm.maxemrich.de (Try it by pressing 1,2 and 3 on your Keyboard) «
Emerging from conversations with IBM scientists and designers, the project was turned into an interactive
3D interface using Grasshopper, adding additional data and highlighting different sections of the data.